The United States is just a few months into what will undoubtedly be a contentious election year. Leading up to the November election, polling will help news media publishers tell the election story, and what the public thinks about the candidates and the public policy issues most important to them. How reliable are polls today — political or otherwise? E&P asked the experts.
Tim Malloy became a poll analyst with Quinnipiac University 12 years ago, after over 30 years as a reporter, TV news anchor and author. The Quinnipiac University Poll began in 1988, and over the decades, national and international news media have cited its findings.
“We follow the headlines, and we build our questions around them — mainly national issues, like the presidential horse race, abortion, the border, guns, fracking, any number of things. We’ll spend two or three days coming up with the questions,” Malloy said. “We’ll throw in 10 or so ideas, and then a carefully written script is created. … Then it goes to 100 or more callers in our call center, who — for four or five days — call thousands of home phones and cell phones.”
They gather data about the respondents, such as age, race, gender, level of education, income level, religion and other categories. By design, the polls are brief. They begin with a “big-picture question” and then ask a subset of related questions.
It’s important to remember that individual polls are not long-term predictors; rather, they offer a snapshot of a moment in time.
“We just did a poll that got a lot of attention,” Malloy said. “We found that Biden had moved up to a six-point lead on Trump. There was a huge move among women because this came right after the New Hampshire primary, [when the former president was harshly critical of Nikki Haley], and during the E. Jean Carroll suit.”
Not only do headlines and election cycles inspire their polls, Malloy said the team also receives suggestions from the public — which is really what polling is all about. “We’re the vehicle by which people get to tell us what they think about the issues. … We’re the conduit of the voices of the people,” Malloy said.
Meaningful comparisons, over time
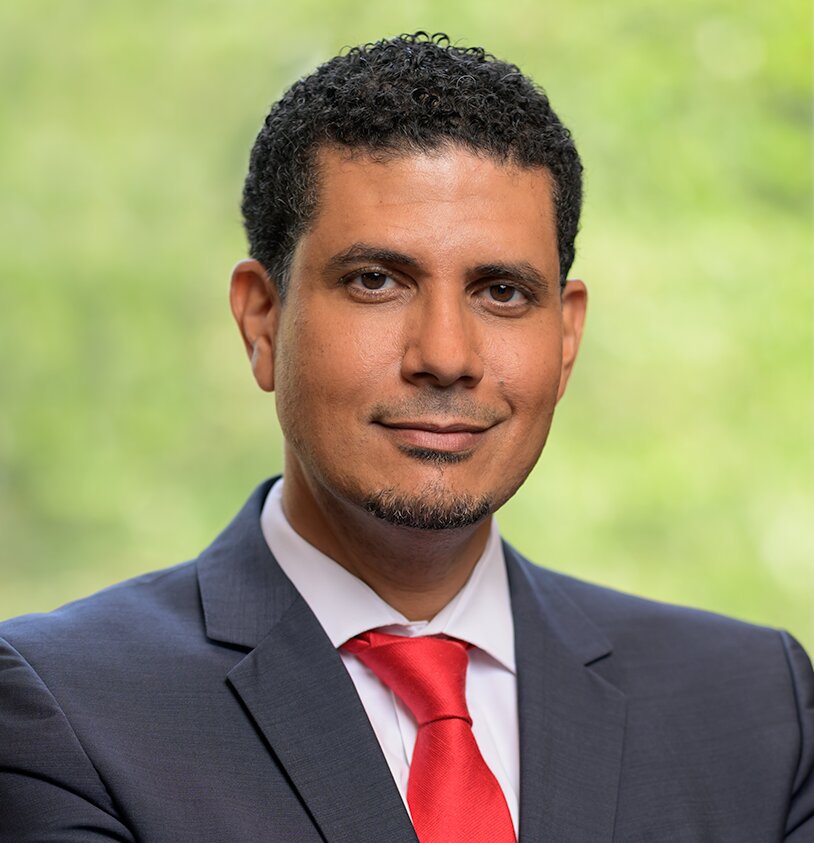
Gallup Inc. is both a news media publisher and an international polling organization. Mohamed Younis is Gallup's editor-in-chief, leading a team of public opinion research experts.
“Polling gets a lot of focus in an election year, but it’s something we at Gallup are doing every year, all year round,” Younis said.
As part of the Gallup Poll Social Series (GPSS), they’ve measured the mood of the nation every January for more than two decades. They’ve asked Americans about COVID’s impact and sought perspectives on the economy and inflation. They've conducted polls on political issues and ideology, presidential approval ratings, public opinion about education and family dynamics, among many other issues.
Gallup relies on two primary methods of surveys — phone polls using Random Digital Dialing (RDD) and online surveys. “Response rates are down, on average, to about 6% to 7% — that’s the number of people you call who complete the survey,” Younis said.
Gallup’s long history enables the company to look at opinions over time.
“If we want to measure how Americans feel about healthcare, our approach is to ask them regularly and the same way over time and compare the results. Last week, we released our trends on political ideology in the United States,” Younis said. “What we found is essentially that women who are 18 to 39 and women who are 65 and older are becoming more liberal. The only reason we can actually report that is because we've been asking the same question now for over 30 years and in the same way.”
“One of the other polls we released this week is how satisfied Americans feel with their personal lives. One of the most interesting things about that report to me was that the rate of Americans today who said they’re ‘very satisfied’ is about on par with where we were in the Great Recession of 2008. … But we’re not in a recession right now. Unemployment is exceptionally low compared to 2008, yet Americans' satisfaction with their lives has crawled back down to that level. We're also tracking how Americans feel about inflation and see that a majority of them say that it's still causing them financial hardship. So, there are reasons why trends look that way, but without measuring it over time, you don't have that comparison point.”
Younis is often asked, “Can we trust polls?” His response: “It depends on the poll.”
“What has been increasingly the norm now in political news, specifically, is reporting on aggregates, which means gathering all the polls they can get their hands on and spitting out a projection or forecast,” Younis said. “It makes for quick reporting, but the challenge is that you’re not really comparing apples to apples in terms of the polls you’re aggregating. It creates a lot of noise — statistical noise.”
Polling for The Times

The New York Times doesn’t just report on polls. It conducts its own, typically with partners. For example, there’s the flagship Times/Siena Poll — a partnership between the Times and Siena College — which measures politics and public perspectives about policies and political figures. E&P spoke with Ruth Igielnik, staff editor for news surveys, and William Davis, director of election analytics, about polling best practices.
One of the things they look for in a polling partner is full disclosure. “How transparent they are in providing information about how they conduct the poll says a lot about a polling organization,” Igielnik said.
The integrity of a poll relies on how the questions are framed, whether the sample is large and whether it is represented across a range of demographics.
“There are lots of different ways that a poll might end up not being accurate, but certainly one important way is whether or not the question is balanced and fair, and that it is interpreted in a consistent way among all respondents,” Davis said.
Sometimes, the questions can be rhetorically sound and yet produce responses lacking insight. Igielnik and Davis cited a poll they conducted in 2022, which sought to understand policy issues most important to respondents. They used a scale, asking the people they polled to rate each issue according to those that were extremely important, very important, somewhat important or not important at all.
“Seventy-five percent of the voters said ‘extremely’ or ‘very important’ for every issue we asked about,” Davis said. “I would say that’s not a badly worded poll question from a textbook perspective … but it was hard to know from that set of questions in that particular survey what was driving people’s vote.”
To reach the public, they leverage RDD and other resources, like a nationwide dataset of all registered voters.
“When I started in polling about 15 years ago, response rates were around 10%, and we were all just completely panicked that so few people were picking up their phones. Now, response rates are closer to 1% or 2%, so it’s gone down pretty dramatically,” Igielnik said.
Last year, the Times team conducted an experiment in Wisconsin, offering people financial incentives to respond to a poll. Igielnik reported that the response rate increased to 30%.
A question news media publishers face: Is the public interested in the polling methodology or just the results? “Methodology is complex. I don’t think most readers get a lot of deep understanding from polling methodology. But, it’s really incumbent on us as journalists to understand how much weight to put into any particular poll result,” Davis said.
“Sometimes, at The New York Times, we decide that a poll result isn’t worthy of being discussed in our pages at all,” he continued. “Sometimes we add a note that adds some nuance or explains the results. We look at what other polls are finding and whether it’s within reasonable bounds of what other polls are finding or what we’d consider an outlier finding. … It would be irresponsible as journalists to make a lot of hay out of a number we have reason to believe may not be accurate.”
Trust in news media is famously low, which also carries over to polling.

“A good example of where polling got unfairly blamed was the 2022 election when there was this narrative going into the election that there was going to be a ‘red wave’ or that a red wave was possible,” Davis recalled.
“In fact, if you look at the average across all polls, which we think is a really great practice to do, that was not what polls were finding at the moment. Polls generally found Republicans to be a little bit ahead in national polls for the Congressional ballot. That's certainly what the Times/Siena poll found, and in general, Republicans finished slightly ahead in the closest thing we have as a measure of the popular vote, which is the House,” Davis said.
“That was actually a very good year for polling. It was not, I think, a tremendous year for analysis and the common narrative,” Davis concluded.
How can newsrooms instill trust in the polls they publish?
Igielnik suggested, “Being discerning in terms of the quality of polls and what we choose to write about.”
 Gretchen A. Peck is a contributing editor to Editor & Publisher. She's reported for E&P since 2010 and welcomes comments at gretchenapeck@gmail.com.


Comments
No comments on this item Please log in to comment by clicking here